Static vs Dynamic memory locations
- Nov 2, 2017
- 4 min read
In the previous post, we isolated data we were interested in and changed its value. However, if we were to restart our application and repeat the process, we would end up with a new memory address for our variable. This is because each process is run in its own virtual address space, and the memory locations of its executable, dynamic libraries, stack, and heap are randomized each time (see ASLR).
This explains the changing address for our variable (which was on the stack). It is not feasible to track down this data every time we rerun the application. We need to find data which is more predictably located. This rules out allocations made on the stack or the heap, whose memory addresses change with each run (some stack variables are pseudo-static and can be found reliably, but we will come back to that) . We are left with variables with a global lifespan. These would include any globally declared variables, static class members and variables declared with the "static" keyword inside functions, in other words, program data which ends up in the Data Segment or the BSS Segment of our executable. These variables will always be present at a fixed offset from the base address of the executable module.
Lets take a look at how cheat engine displays these values. We will borrow our original program but move the target value outside the function to make it global.

Run the program, start up cheat engine, and open the program in it. Using the process we used earlier, you can isolate the value once again.
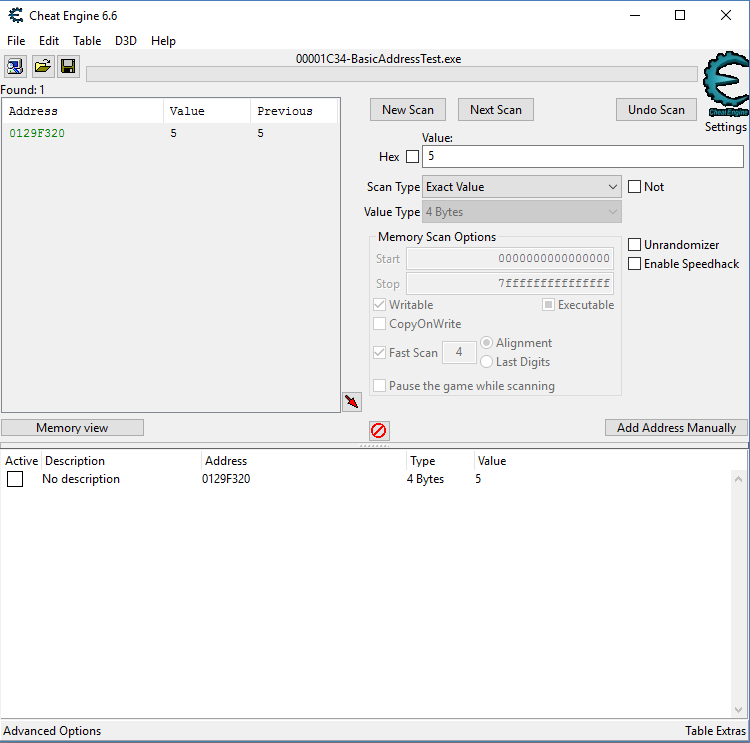
You will notice that the address is green this time. This is cheat engine's way of telling you when an address is static. Dynamic addresses will be shown in black. You can double click on in to start tracking it. If you restart your program and open it in cheat engine again, the tracked address should still contain the variable we are tracking. If you had frozen the variable, you can print out the value to verify that you still have control over it. The address being tracked is not an absolute address in the processes' virtual space. It is relative to the start of the executable image. If you double click on the address in the tracked addresses window, it will show you the address in the form of "ExecutableName.exe + offset" ("BasicAddressTest.exe+1F320" in my case), where "ExecutableName.exe" implies the starting address of the executable module. The calculated address will always point to our global variable, even if the executable is loaded at different addresses. This gives us a reliable way to manipulate the program.

Lets look at how cheat engine actually figures out which addresses are static (i.e, they lie in the data section of the executable). The executable for our program follows the PE file format, which describes the layout of executables for Windows. This article is a great source of information on it.
I will try to condense the article into the useful bits we need to extract the range of the data segment for a given program.
Each executable file has a small DOS program at the very beginning, in order to output an error message on the DOS OS to indicate that the program was not meant for DOS. The DOS header for this program gives us the actual offset to the PE header. The PE header consists of three members.
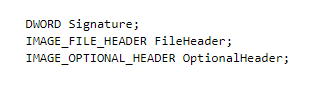
The signature is used to verify the file format (and should be "PE\0\0" for a PE executable). The "FileHeader" struct has a field denoting the number of sections in the image, aptly named "NumberOfSections" (we will note its value).
After the PE header lies the "SectionTable", which is just an array of "IMAGE_SECTION_HEADER" structures which hold information about the starting address and range of each data section (among other things).
Here's the struct definition
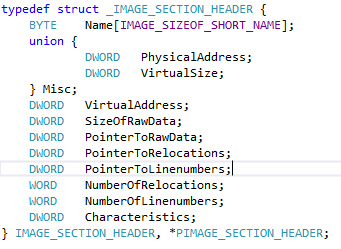
By using the "VirtualAddress" and "VirtualSize" fields, we can find the range of the data section for the executable. Any address belonging to this range is static (green for cheat engine)
Let's conduct a quick test to verify this.
We will need the program from our previous article, as well as a new one to calculate the range of the data section. Our new program will need to get the module handle for the program under inspection, loop through the image section headers to find the data section, and get its start address and size.
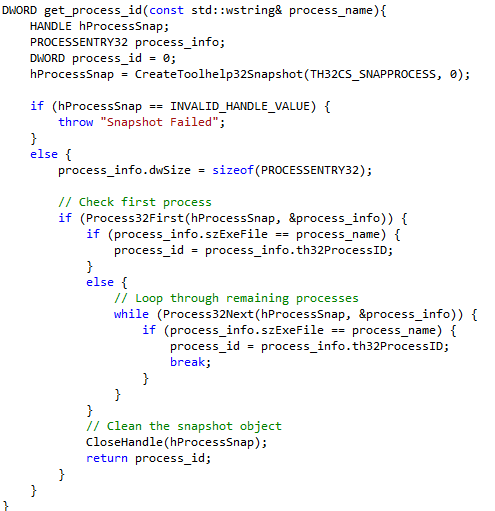
Our first step is to get the process id for the target process.
We use the "CreateToolhelp32Snapshot" function which lists all the running processes in the system
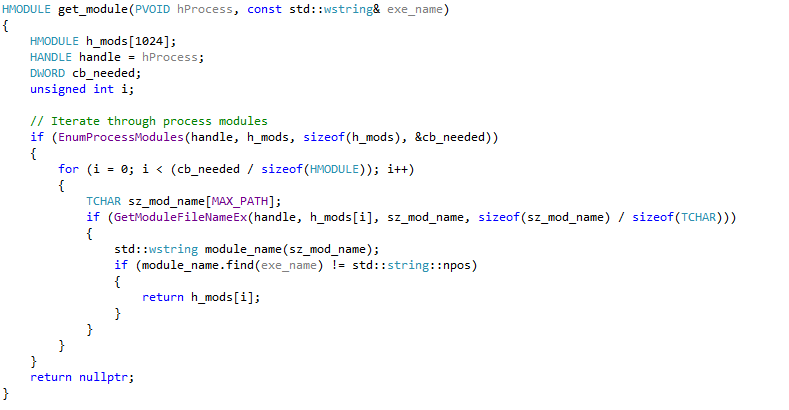
Next, we get the module handle for the target executable. We use "EnumProcessModules" to list the modules in our target process. This will give us a list which includes our executable module and also the dynamic libraries used by the process.
The HMODULE is actually the start address of the executable image in its virtual address space. This also coincides with the DOS header for the executable. We use "ReadProcessMemory" to read the PE header struct from the target process. We then loop through all the sections in the image till we find the data section, and calculate the range. Here's what our main function looks like

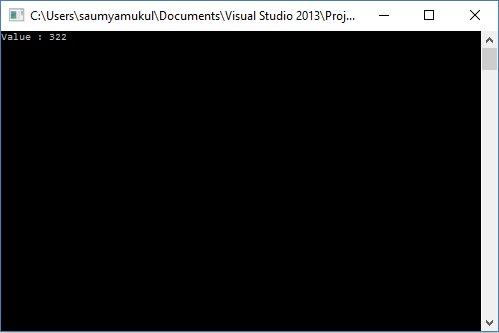
This is the data section range I got on my machine.
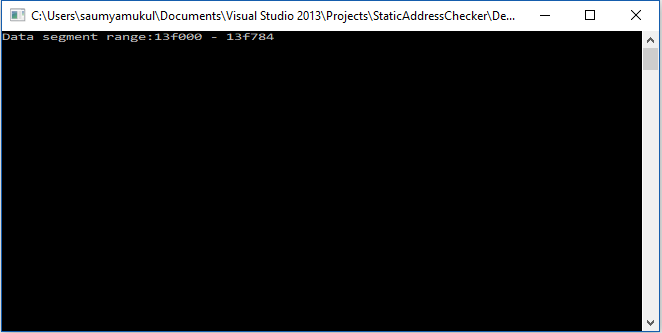
Loading up cheat engine and using the steps outlined in the previous article to find out the address of the global variable ( 0013F320 in my case) , we can verify that it does indeed lie in the data section.

Comments